
My last post closed with a poll on achieved M-ratio values. Here are the results:

Unfortunately, not too many readers participated – so the statistics of the result are a bit weak. To some extend the data is reflecting my personal experience – what I have seen in various FABs. There is a significant amount of FABs (40% in the poll results) which have M-ratios below 1. In other words these FABs experience more unscheduled downtime than scheduled down time. The majority of the FABs in the poll (60%) shows a M-ratio greater 1 – they have more scheduled than unscheduled downtime.
Interestingly there are no M-ratios greater 5 looks like – which means at least 16.7% of all downtime is unscheduled. Compared to other industries this looks not too good. Imagine for example your car would have an M-ratio of only 5 …
Similar to semiconductor equipment, a car is nowadays a complex piece of machinery, but for sure there is not a lot of unscheduled downtime – at least not mission critical break downs.
With that in mind and knowing that cars of course have humans to transport and therefore the focus on safety and maintenance is (obviously) very different, I came up years ago with the picture below to define M-ratio classes for the semiconductor FAB world:
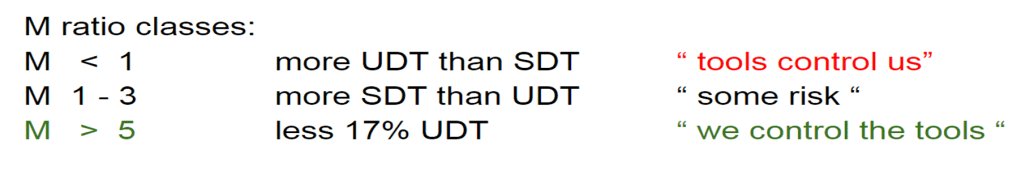
The reasons for having an M-ratio below 1 might be plentiful, but a key for that is for sure the general maintenance strategy of a FAB. M-ratios below 1 indicate in general a “run to fail” strategy. Often the reason for that is the cost aspect of a dedicated Preventive Maintenance set up, since man power, parts and meticulously executed scheduled maintenance are not easy and cheap to have. Another reason might be the age of the equipment and the availability of spare parts.
M-ratio as an indictor is not good for use as the one and only goal – since the real goal of equipment maintenance is to enable highest possible uptime – with “no-surprise” down times – but knowing the M-ratio of your factory might help to identify improvement opportunities.
Often the equipment organization in a FAB is measured (and valued) by indicators which only cover the pure equipment aspect. Therefore all optimization is focussed on getting these equipment centric indicators “look good”. Equipment performance and if an equipment goes down unplanned often can have massive impact on the WIP flow of the factory. Therefore the impact on the FAB cycle time and worst case on on-time delivery is not always taken into consideration.
In all my years I have seen a few typical “strategies” to deal with that problem:
- “run to fail” least cost maintenance approach (from a pure maintenance cost point of view)
- “zero unscheduled downtime” as an overarching end goal – to be fully in control, possibly even at the expense of lower overall uptime
- “predictive maintenance” do only interrupt when needed
While “run to fail” might be the easiest strategy to execute, it is also a completely reactive way of taking care of the equipment and often not good for the overall FAB performance. Aiming for almost no unscheduled downtime in the traditional way needs a very systematic and disciplined Preventive Maintenance program, which has been demonstrated to be doable but it comes at the expense of sometimes taking tools down for a scheduled maintenance, when it would be not really needed.
“Predictive Maintenance” seems to be the best solution of both worlds since it would only take an equipment down if it is really needed. The key here is to define “really needed” and to avoid running to fail. It would need to be detected early enough, so the needed action can be planned – for example “some time in the next few days” when it fits to the overall FAB and WIP situation.
I have seen papers and presentations about predictive maintenance for many years and it seems it was always the best thing to do.
The process and metrology equipment in a FAB represent a significant part of the total FAB investment and define to a large part what the overall FAB capacity and FAB speed will be. So one would assume that maintenance must have high priority, but M-ratio values in 2022 do not always support this assumption.
If you want to get more insight on the M-ratio indicator – a great read would be James P. Ignizio’s book
In chapter 8 of his book – titled
“Factory Performance Metrics: The Good, The Bad, and The Ugly”
M-ratio is discussed as well as other uptime related indicators.

Hi Thomas
I totally agree to your point of view.
There is certainly also other aspects to keep m-ratio
as high is possible.
Unscheduled down request more resources and high inefficiencies because of non standard procedures and may missing skill level.
This needs also take in consideration.
LikeLike
Hello Joerg,
Thank you for sharing these great additional points !
Thomas
LikeLike