
Happy New Year !
This will be the last part of the Bottleneck discussion. As mentioned in part 3 – I think the most objective and telling indicator to see what is the true factory bottleneck is:
highest average lot wait time at a tool group
Wait time or cycle time in general is one of the very few indicators which can not be easily manipulated or “adjusted” by using different methods of calculation or aggregation. Time never stops and measuring the time between a lot arrives logically at a step and it starts processing at the step (on an equipment) are 2 simple time stamps which are typically recorded in the MES of the factory. For example:
lot arrived at the step: 01/02/21 4am
lot started processing: 01/02/21 10am
The wait time of the lot is super simple –> 6 hours.
The beauty of this metric is that no other information is needed – just these 2 time stamps. It will cover any possible reason why the lot waited 6hours – no matter what:
- equipment was not available due to down time
- equipment was not available since it was busy running another lot
- lot was not started due to missing recipe
- lot was not started due to no operator available
- lot was not started since operator chose to run another lot
- lot was not started due to too much WIP in time link zone
- lot was not started due to schedule had it planned starting at 10am
- lot was not started due to … “name your reason here”
One key part of the FAB Performance metrics – as discussed in part 2 – is:
- deliver enough wafers in time –> customer point of view –> cycle time of the FAB
In other words once the decision was made to start a lot into the factory it has some kind of target date/time by when this lot needs to be finished or shipped. Any wait time is by nature now a “not desired state” especially if the wait time is “very long”. That means tool groups which generate the highest average lot wait time will be very likely the biggest problem or bottleneck.
Let’s have a look at some example data to illustrate that:

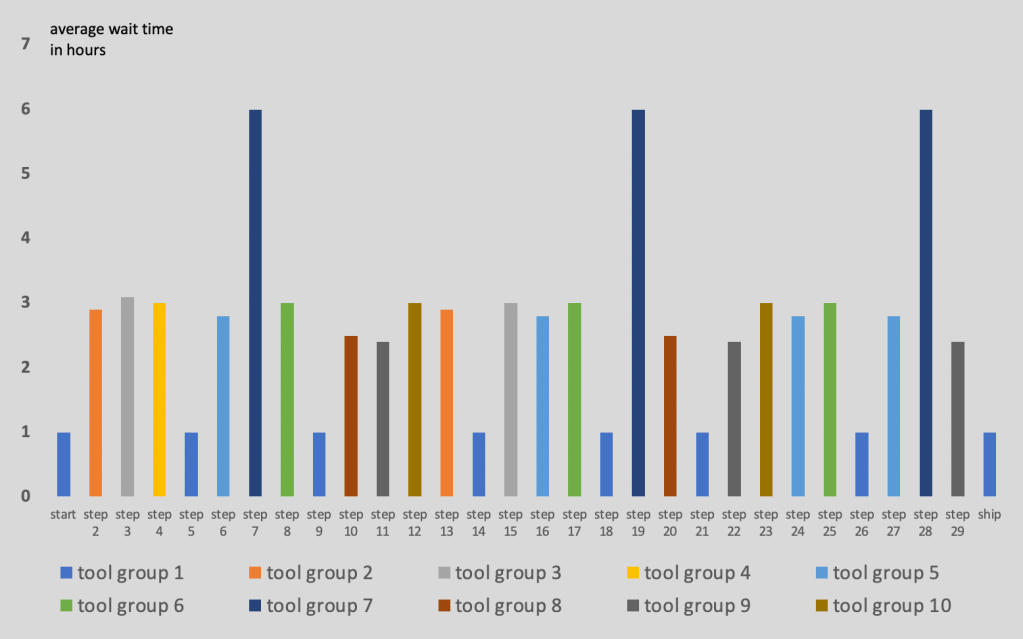
The chart above shows the average lot wait times per step of our complete factory. Some steps have 1h wait time others have up to 6h.
Since this chart shows the data by step in the order of the route or flow it does not tell immediately which tool groups are the various steps running on.
The same data – including the tool group context – will tell this better:
If we now aggregate and sort this by tool group instead of step we have our bottleneck chart:

From this chart tool group 7 clearly has the greatest average lot wait time of all tool groups. An interesting version of this chart is the “total wait time contribution” chart which shows the sum of the individual step wait times.
For example tool group 7 has 3 steps in the route and on average a lot waits on each step 6h. If we plot the same data as “total wait time contribution chart” we will not average the wait time of the individual step but add them: Tool group 7 will show 6h + 6h + 6h = 18h of total wait time for each lot.

Note that the sort order of the tool groups is now different. For example tool group 1 which on average has the lowest wait time (1h) is now ranked as number 4. From an overall “is this tool group a problem for the factory ?” point of view I say no – since lots barely waiting there – it just happens that tool group 1 has a lot of steps in the flow. I strongly lean to the average chart for the overall definition of the FAB bottleneck but recommend always to have a look on the cumulative chart as well.
In part 2 of the Bottleneck blog series I discussed the “Factory Utilization Profile chart”. I think this chart enhanced with the wait time data from above will give the “complete view” what is going on in the factory and will spark enough questions to dig in deeper at the right tool groups.
The chart below shows the data sorted by the highest average cycle time:

Obvious question is: Why is there so much wait time on tool group 7 at such low utilization or asked differently: half of the time the tool group is idle – why do lots wait on average for 6 hours ?
Or another one: How is tool group 1 able to achieve such low wait time ?
At this point I like to stop for a second and point you to an excellent source of additional discussion on the the topic of bottlenecks and cycle time:

If you subscribe to the newsletter, you will have access to past editions as well !
Let me get back to the statement: Any wait time is by nature now a “not desired state” especially if the wait time is “very long”
Given the nature of the wafer FAB the ideal case of zero wait time at all steps is not very realistic since there are too many sources of variability in a factory. Therefore experienced capacity planners and production control engineers typically set an expected wait time target per step (and therefore by tool group). Using these expected wait times, the definition of “very long” becomes easier.
For example if
tool group A has an expected wait time of 2hours
tool group B has an expected wait time of 5hours
An actual achieved wait time of 6 hours would be kind of tolerable on tool group B but clearly seen as very high on tool group A.
Setting expected wait times per step and/or tool group depends on a lot of parameters, like:
- planned tool group utilization
- number of tools in the tool group
- duration of process time
- batch tool / batching time
- lot arrival time variability
- many others
I’m curious what the readers of this block think would be an acceptable average wait time for non bottleneck steps in a fully loaded factory.
Let’s assume that most steps in the factory have processing times of 30 – 60 minutes, running on non-batch tools, and the factory is fully loaded = the capacity planners tell you, you can not start more wafers. What would be an acceptable average lot wait time for these steps in your opinion ?
Please vote below, what you would see as good / o.k. / acceptable:
I will share and review the results in my next post.

Great stuff, Thomas! I think you make an excellent case for that chart and for the queue time metric in general. And I thank you for recommending FabTime’s newsletter – this discussion is certainly the type of thing that our newsletter readership is interested in.
We’ve been big proponents of using operation-level (or tool-level) x-factor to identify bottlenecks, but I do find in practice when I look at data that it’s easier to just look at the average queue time per visit. I will certainly send my newsletter readers to read these posts.
LikeLiked by 1 person
I enjoyed reading your blog Thomas. I have been involved in Fab operations for many years and I agree with your recommendation. I like to see WIP and capacity as the input (something we can control) and cycle time as the outcome. I would probably compare Average wait time to a goal since factories ramping up or down may require different actions depending on different WIP levels across the fab.
LikeLiked by 1 person
Thank you for the comment !
LikeLike