
A big thank you to everyone who voted in my little poll, here are the results:
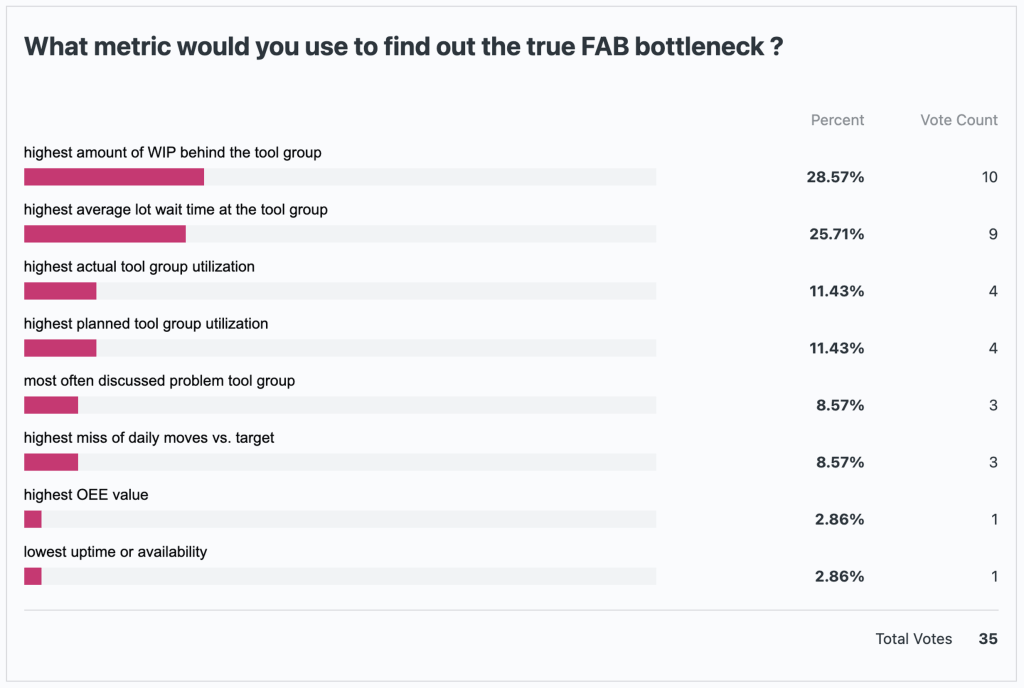
I kind of expected a picture like this – but what does this mean ? Here is my interpretation:
Bottlenecks are widely known as the one thing one should work on 1st to improve the overall FAB performance. But it seems we have different opinions how to measure and therefore to define what is the bottleneck.
For a real existing FAB, that would mean if different people or groups use a different definition, they would very likely identify different tool groups as the bottleneck – for the very same factory ! Of course we did not yet discuss what type of bottleneck we are talking about: a short term current one, a long term planned bottleneck or any other definition. Nevertheless people would identify very likely different tool groups as the key FAB problem …
Before we discuss this a bit more, I think we need to clarify what is the meaning of “bottleneck for the FAB”. In my opinion the purpose of a FAB is to make money and in order to do this wafers need to be delivered to customers in a way that the overall cost is lower than the selling price. Selling price also means one needs to have someone to sell them to – the CUSTOMER. For the purpose of this bottleneck discussion I exclude topics like yield and quality, assuming these are “o.k. and in control”. I will just focus on the 2 other key metrics for “FAB performance”:
- deliver enough wafers in time –> customer point of view –> cycle time of the FAB
- manufacture enough wafers –> total cost / manufactured wafers –> cost per wafer –> FAB output
So in my opinion, a bottleneck is a tool or tool group which negatively impacts the cycle time of the FAB and therefore the FAB output in general, but more specific the output of the right wafers (products) for the right customers at the right time (aka on-time delivery)
With that in mind, I think we need to define the metric in a way that it measures the impact to these 2 parameters. In a semiconductor FAB the typical unit to track wafer progress through the line is a “lot”. Hence, in order to measure how good or bad a tool group impacts the flow of lots through the line, we need to look a lot related indicator. This disqualifies grey marked ones in the picture below and leaves us withe 3 potential candidates

Let’s have a look at the greyed out metrics.
highest planned tool group utilization
It is very tempting to pick this metric since very high tool utilization signals to some extend, we might reach capacity limits soon. Also it is widely known, that tool groups with high utilization tend to also generate high cycle times. So there is a good chance, that the true FAB bottleneck has a high or the highest utilization – but there is not guarantee – that this is the case. This very much depends also on the overall utilization profile of the factory.
Another interesting topic to discuss in a future post is: What means “high” utilization and “high” cycle time? Similar, how to define “FAB capacity”, which I will discuss also in a later post.
highest actual tool group utilization
Everything I wrote above for the planned high utilization is valid for the actual utilization as well. I just like to add at this point, comparing actual tool group utilization and planned tool group utilization should be a frequent routine, to understand how close or distant the capacity model is able to follow the actual FAB performance – or should I say the the actual FAB is able to follow the capacity model ? You guessed it, an interesting topic for another post …
Before we move on into the next metrics, I like to spend a few thoughts on the topic factory utilization profile. The factory utilization profile is a chart of all tool groups, showing their average utilization ( planned or actual, for selected time frame, like last 4 weeks or last 8 weeks) and the tool groups are sorted in a way, that the tool group with the highest utilization is on the left and the one with the lowest utilization is on the right. A theoretical example is shown below:
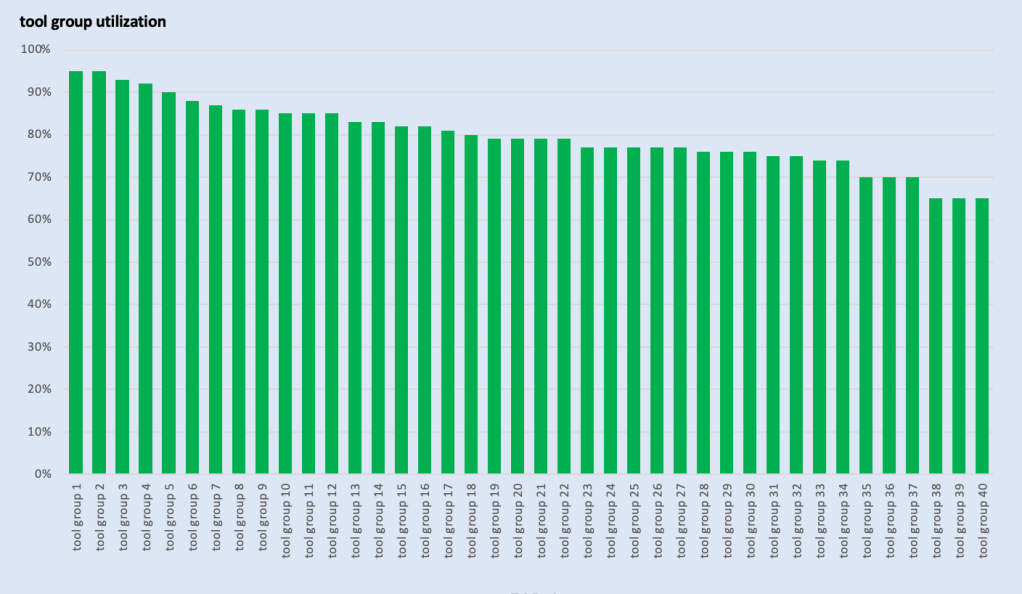
Different factories will have different utilization profiles. Even the very same factory will have different utilization profiles over time if things like wafer starts, product mix, uptime or cycle time change. So I always thought it is a very good idea, to keep an eye on that and also compare the profile planned data vs. actual data. An example of comparison (with dummy data) is below.
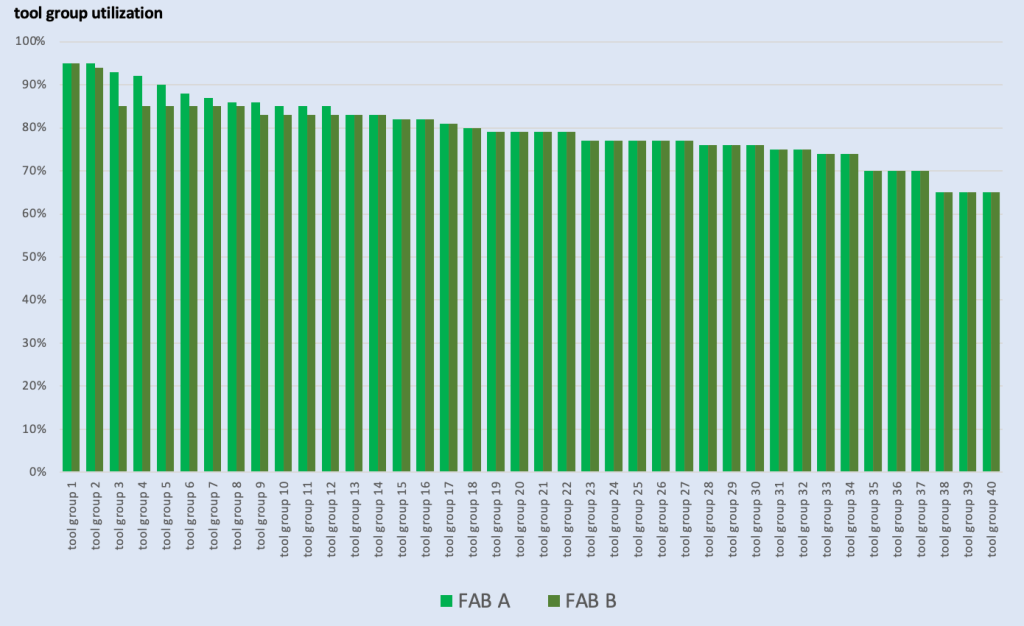
For example: Look at tool group number 3 ! How likely will become #3 a problem in FAB A vs. in FAB B ?
I think you get the general idea, but there is much more interesting stuff to read out of FAB utilization profiles. Before we go there – have you lately checked / seen your FABs utilization profile ?
most often discussed tool group
This metric has some advantage, since it is not focusing on one specific indicator and if a tool groups is very often in focus, it has for sure some problematic impact on the overall line performance. I rather would choose real data based metric, but for FABs with less developed automatic data generation and data analytics capabilities it is a usable starting point. I also like about this approach – once used for some time – it will inherently drive the demand for a more data based approach – to find out, why is a tool group discussed so often and where to start with improvement activities – which in today’s manufacturing world is an absolute must in my opinion.
highest OEE value
OEE it feels had its peek time when a lot of people talked about it, but it seems lately the topic became a bit quieter. The OEE method itself has its value, if used on the right tool groups with the right intentions. If applied solely to increase the name plate OEE value of every tool group in the FAB, it can become quickly counter productive and hinder the overall FAB performance ( at least if FAB performance is defined and measured as proposed in this post) In my active days as an FAB Industrial Engineer I often used the slogan:
“… if the OEE method is used the right way, its target should be not to increase the OEE value of the tool group, but increase the tool groups idle time …”
If OEE projects are aiming in that direction, they will for sure help to improve the overall FAB performance, but as the key metric to identify the biggest bottleneck I would not recommend to use OEE.
lowest uptime or availability
As mentioned above, uptime is a tool or tool group focused metric and for sure a very important one in every FAB. While low uptime is absolutely not desirable, it is not a good indicator if the tool group is indeed a factory bottleneck, since it will not tell us anything about the actual impact on the FAB without other information.
At this point I will stop for today. In my next post I will spend a bit more time on the 3 remaining – lot related – indicators and will also share, which one I think will be the most useful one to use. As always, I would love to hear feedback from you via a comment. One last thing: I will eventually stop announcing every new post via LinkedIn, so if you want to get notified when there is new content here, please use the email subscription form below
Happy Holidays !
Thomas

Very interesting, Thomas. I hadn’t thought about tool utilization profiles as something characteristic of a factory. It seems like the easiest fab to manage would be one with 2-4 tools showing the highest utilization, and then a drop-off to the others.
Anyway, I agree with you about OEE, and about the need to use metrics that reflect the flow of lots through the line. In my cycle time course I talk about how if you want to improve cycle time, you need metrics that reflect current cycle time and/or WIP (which sounds obvious, but there are plenty of traditional fab metrics that don’t do this).
I look forward to your next post!
LikeLike
Hello Jennifer, seems like we are thinking very much alike. Fab utilization profiles are a very interesting characteristic indeed. Also, there is a slightly advanced version, which I will share in my next post.
LikeLike