
I like to resume with the posts on the topic of FAB cycle time drivers. As mentioned in an earlier post – these are some of the key drivers for factory cycle time:
- overall factory size (number of equipment available to run a certain step)
- overall equipment uptime and uptime stability
- M-ratio
- rework rate
- product mix
- number and lengths of queue time restricted steps in the process flow
- lot hold rate and holt times
- degree of automation of material transport
- degree of optimization in the dispatching / scheduling solution
I covered the factory size topic already – so here are a few thoughts on equipment uptime. I think everybody knows and agrees that equipment uptime is a very key parameter. Equipment Uptime has direct implications on the factory capacity and even in the most simple, Excel based capacity planning model, you will find a column for planned equipment uptime. But of course the impact on capacity is only one aspect.
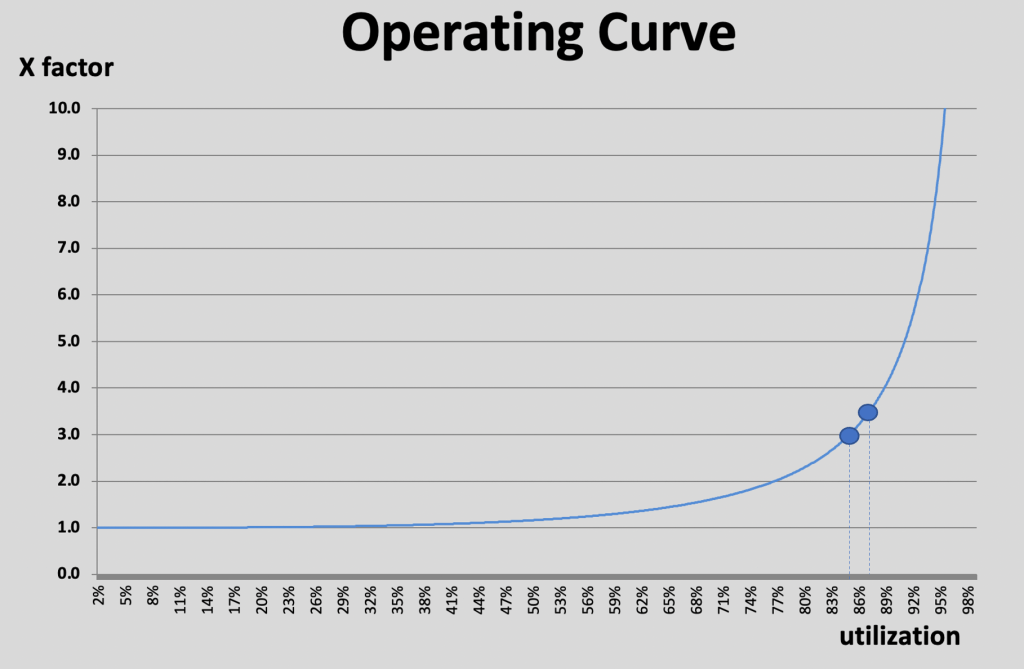
One could ask: Capacity – at what factory cycle time ? Based on the earlier discussed operating curve, a FAB has different capacity at different cycle times. Here comes the equipment capacity into the picture. The ideal FAB achieves the planned uptime on each tool group also in real life.
But what does it mean, if a tool group achieves its planned uptime ? We need to look a bit closer. Over what period of time does the tool group achieve for example 90% ? The capacity planners typically assume an average uptime number and somewhere in the fine-print you can find if this is meant to be for a 1 week, 4 weeks, 13 weeks or another time frame. For the real FAB these timeframes of interest are usually much shorter – if a few key tools are down right now for let’s say 2 hours – that might create already a lot of attention.
A deviation from the average planned uptime has the potential to impact the FABs cycle time. Assuming that the incoming WIP to a tool group is somewhat constant over time (which is already an optimistic assumption) higher or lower average uptime will result in higher or lower effective tool utilization and that means the wait time of lots will be different:
If we zoom in a bit more, tool groups with the same average uptime might have different impact on the lots wait time based on how the day to day, shift to shift or even hour to hour uptime looks like.
Below are 3 “constructed” uptime day to day cases to illustrate that.
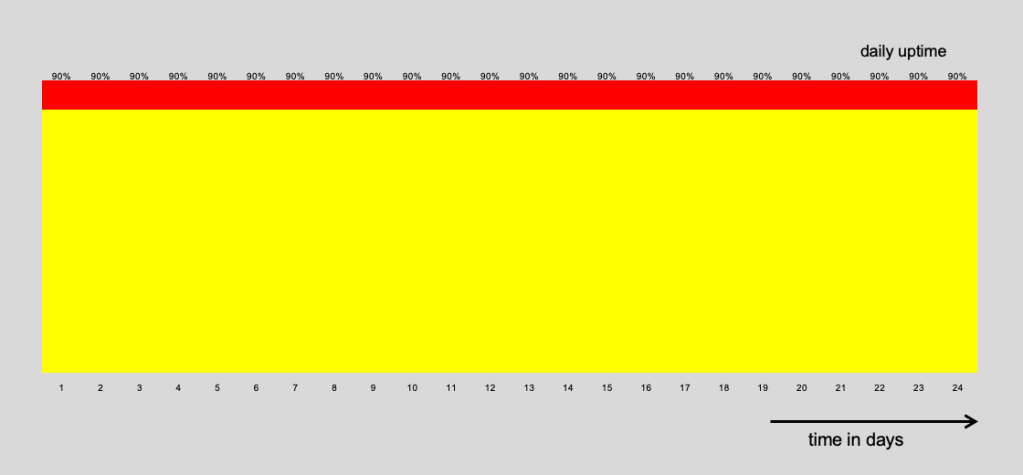
Tool group A has every single day 10% downtime (red) and 90% uptime (yellow) – no big surprise that the average uptime is 90%
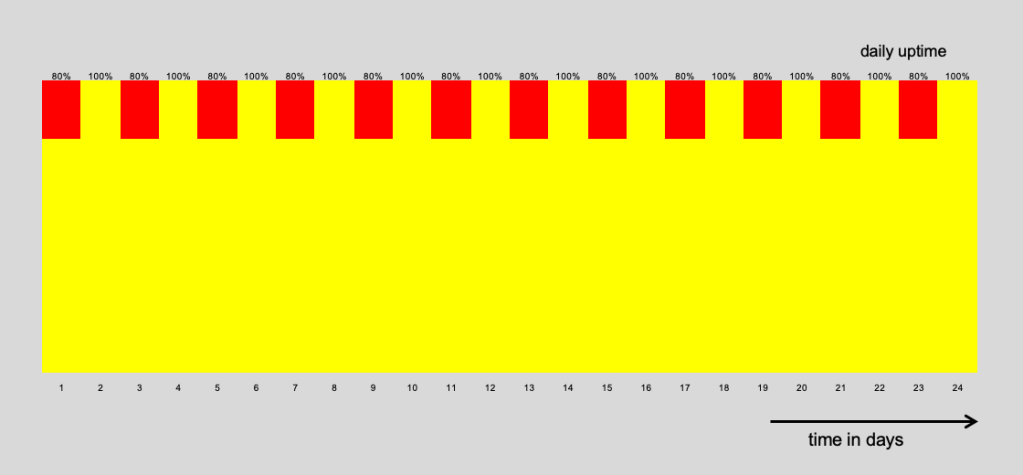
Tool group B has alternating days with 80% or 100% uptime – which will result in the same 90% average uptime for the full time frame
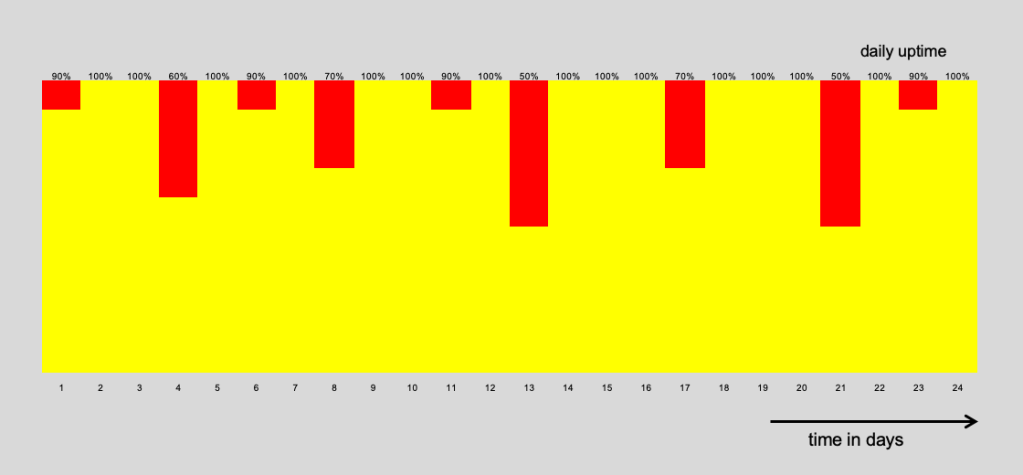
Tool group C has a very different down time pattern, but the average will be again 90%. To make you believe it – take visually all the red blocks more than 10% and fill them into the 100% uptime days and you get the picture from tool group A)
If your capacity planning team is using average uptime values for capacity planning, these 3 tool groups are treated exactly the same. For static capacity planning purposes this will be fine, but if you like also to calculate/estimate/forecast the overall factory cycle time, these 3 tool groups will very likely impact the WIP flow differently and therefore the lot cycle time will be different as well.
Once this point of general understanding is reached the obvious next questions are:
1. Which uptime pattern is better for my factory A, B or C ?
(better as in: enables more stable and lower cycle time)
2. How do I change the not so good ones to look more like the best one ?
I will discuss this a bit more in the next post.
